Monitoring
What is a stock tracker and how does it work?
A stock tracker is an online tool for recording, monitoring, and analyzing investments. It brings portfolio positions together and shows how their market value changes.
Share quantities and the current result of every position.
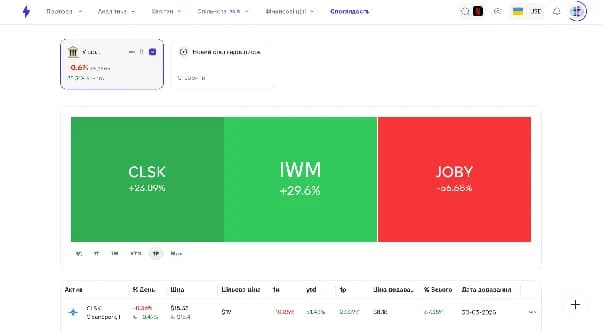
Assets that contribute most to profit or loss.
Allocation across assets, sectors, and countries.
How closely the current structure follows your strategy.
Less manual work
Less portfolio chaos — more control with Strum
As the first trades grow into stocks, ETFs, currencies, dividends, and other investments, manual records become harder to maintain.
Bring assets from different sources into one place.
Compare a company’s current price with your average purchase price.
Control allocation without maintaining custom formulas.
Spot excessive concentration and deviations from your strategy.
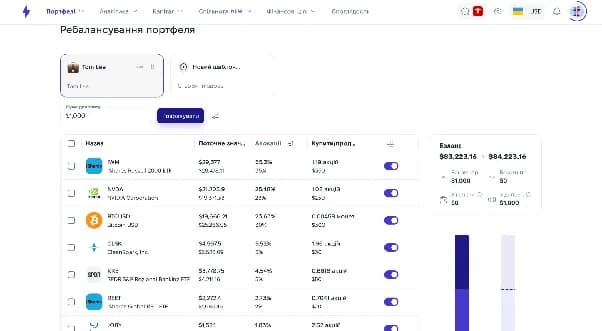
Calculate rebalancing around your target allocation.
A tracker does not guarantee returns or remove market risk. It gives investors structured information for making their own decisions.
Capabilities
Core features a stock tracker should have
| Capability | What it gives you |
|---|---|
| Stock records | Every position, its current value, and portfolio weight |
| Asset analytics | Profit, loss, structure, and investment dynamics |
| Broker synchronization | Less manual work with new transactions |
| Watchlists | Monitor a stock before buying it |
| Rebalancing | Calculate how to move toward target allocation |
| Financial goals | Goal scenarios connected with the portfolio |
Four steps
How does Strum help you track stocks?
1. Add your portfolio
Create a portfolio and enter positions manually, upload a CSV file, or connect an available brokerage synchronization.
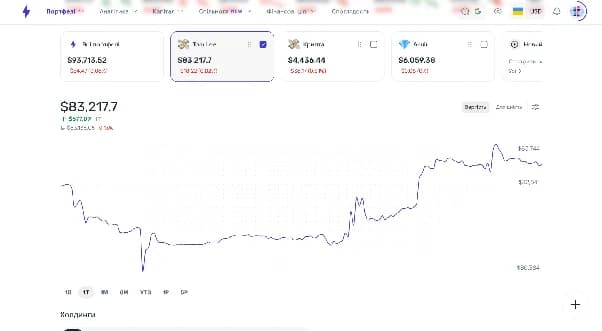
2. See different asset types together
Strum shows stocks, ETFs, crypto, cash, and custom assets in one system so you can assess total capital instead of a single investment.
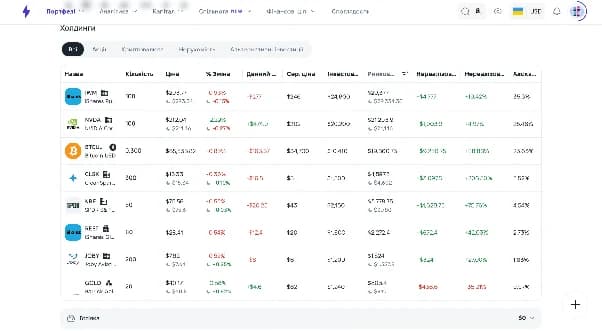
3. Analyze returns and structure
Review P&L, dividends, capital dynamics, sectors, countries, and each asset’s contribution to the overall result.
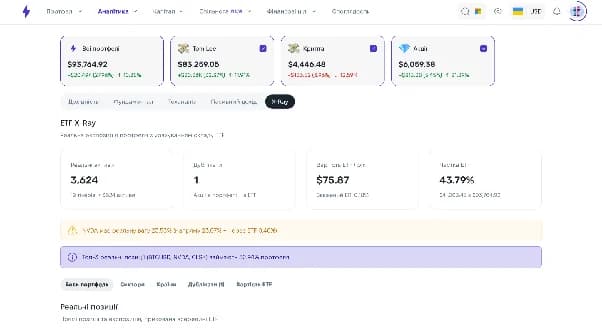
4. Plan goals and rebalance
Connect the portfolio with a goal, model the time horizon, contributions, returns, inflation, and risk, then compare the current structure with your strategy.
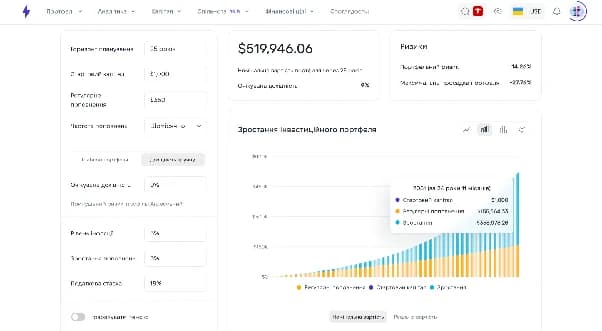
Who it is for
Who can manage stocks more effectively with Strum?
Beginners who bought their first stocks and want to understand the result.
Investors with several positions or portfolios.
Interactive Brokers and other brokerage customers.
People moving from spreadsheets toward automation.
Owners of stocks, ETFs, crypto, cash, and other assets.
Investors connecting a portfolio with long-term financial goals.
Each user independently chooses their strategy, acceptable risk level, and buy or sell decisions.
Comparison
Why Strum is a more convenient stock-record alternative to spreadsheets
A spreadsheet can work for two or three positions. Once currencies, brokers, dividends, and more assets are involved, a specialized platform is more practical.
| Criterion | Spreadsheet | Strum |
|---|---|---|
| Data updates | Often manual | Import and available synchronization |
| Complete picture | Requires setup | Data is consolidated in one interface |
| Analytics | Custom formulas | Ready-to-use analysis tools |
| Rebalancing | Manual calculation | Dedicated functionality |
| Financial goals | Tracked separately | Can be connected with a portfolio |
Before you buy
Watchlists: keep interesting stocks in view
Not every asset needs to be purchased immediately. Follow companies, assess movements, and wait for the price level that matches your plan.
Create separate stock watchlists.
Set a target price and desired entry level.
Compare the current price with the price when you added it.
Review historical movement.
Keep owned stocks separate from potential investments.
Portfolio metrics
Portfolio analysis
Current market value of all positions.
Profit and loss by asset and for the full portfolio.
Realized and unrealized P&L.
Weight of each stock and capital concentration.
Allocation by asset class and capital dynamics.
Alignment with target allocation.
Automation
Broker synchronization: less manual work
Connecting a broker helps automate records for new transactions and reduces the risk of errors during manual entry.
Connect a brokerage account to an existing portfolio.
Wait for the available data to import.
Review imported assets and transactions.
Use analytics to control the portfolio.
Interactive Brokers can be connected to Strum through Plaid. Once configured, new transactions from the synchronization date are added automatically.