The basics
What is an investment tracker?
An investment tracker is an online tool that shows portfolio structure, asset values, trades, returns, dividends, financial goals, and changes in capital in one place. Instead of several files and apps, you get a complete view of your finances.
Capital control
Why do you need an investment tracker?
When data sits across a broker, bank, crypto wallet, spreadsheets, and notes, assessing your capital becomes difficult. Currency moves, fees, dividends, and new trades are easy to miss, especially across several portfolios.
Problems with scattered records
There is no single capital total, actual performance is hard to measure, currencies and fees are easy to miss, and strategy alignment is unclear.
How a tracker helps
It shows the complete capital picture, stores trade history, simplifies allocation control, highlights imbalances, and connects portfolios with goals.
Five steps
How does Strum help you track an investment portfolio?
Create a portfolio, add positions manually, upload a broker report, or configure an available connection. Your balance, transactions, and performance then live in one interface.
1. Bring assets into one place
Manage several portfolios containing stocks, ETFs, bonds, crypto, cash, and other positions. The dashboard shows capital, holdings, market changes, and allocation.
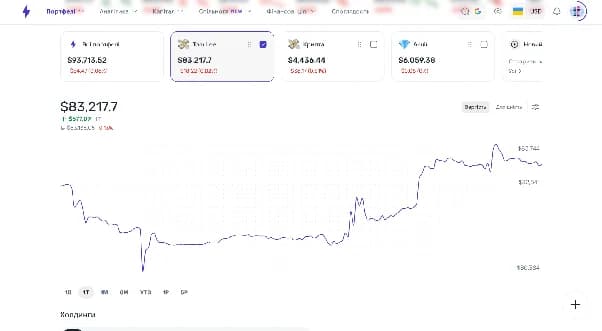
2. Track trades, expenses, and investments
The transaction journal records buys, sells, transfers, income, expenses, and fees with a date, asset, quantity, price, and description.
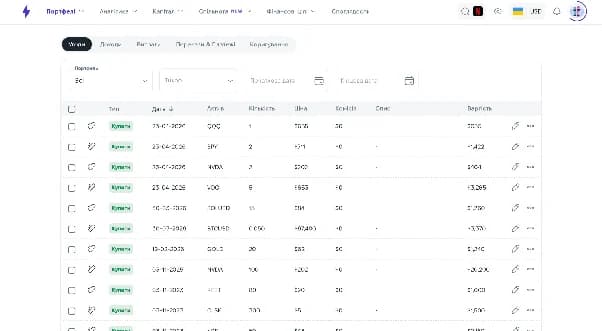
3. Analyze returns and P&L
Review daily P&L, average purchase price, invested amount, market value, unrealized P&L, and each position’s contribution.
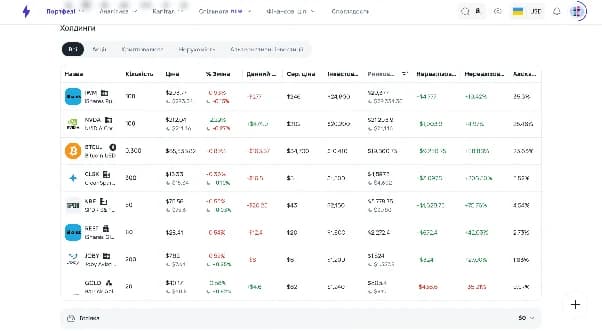
4. Check allocation and rebalance
Compare allocation by asset class, sector, country, and currency with your target allocation to identify deviations from your strategy.
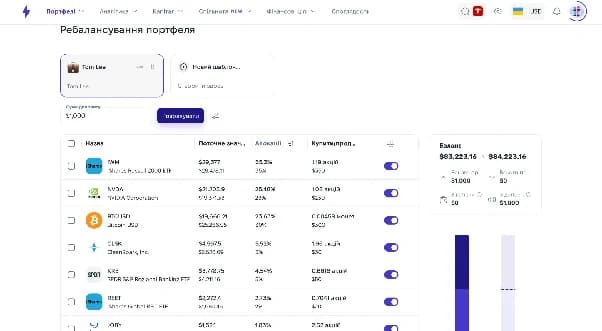
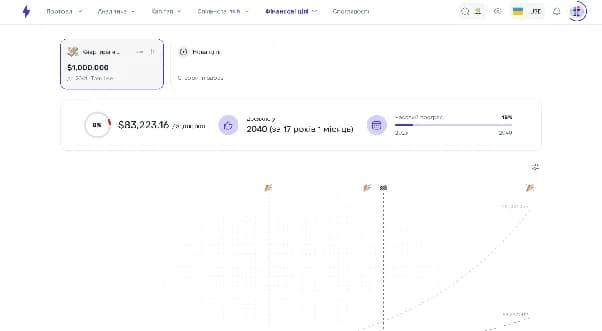
5. Plan financial goals
Model retirement, passive income, a major purchase, or financial independence with contributions, inflation, taxes, expected returns, and risk.
Capabilities
Core investment tracker features
| Feature | Why it matters |
|---|---|
| Multiple portfolios | Separate long-term, active, or family strategies |
| Different asset types | See stocks, ETFs, bonds, crypto, and cash together |
| Broker synchronization | Reduce manual transaction entry |
| Trade journal | Control buys, sells, transfers, and fees |
| P&L analytics | Measure returns and changes in portfolio value |
| Dividends and payments | Review passive income and plan cash flow |
| Rebalancing | Keep allocation aligned with the target |
| Financial goals | Connect capital with a specific plan and horizon |
Long-term view
A portfolio tracker for long-term investors
Strum supports systematic capital management over 5, 10, or 20+ years. Evaluate a strategy through broader changes instead of a single month.
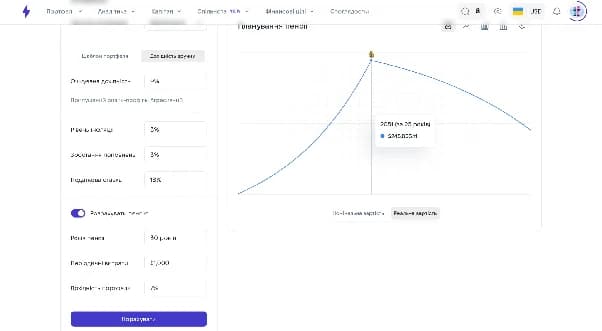
Retirement portfolio
See how the projection changes under different assumptions for returns, inflation, taxes, and recurring contributions.
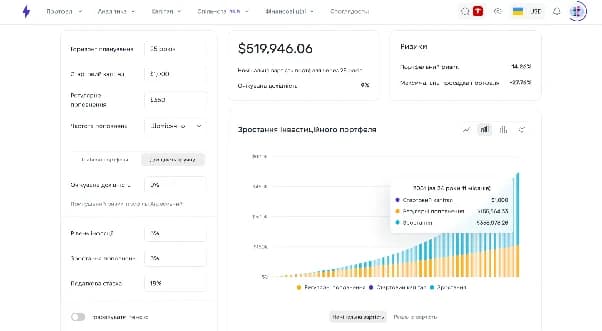
Passive-income portfolio
Track progress toward the desired passive income and compare the contribution of starting capital, deposits, and growth.
Comparison
Strum vs Excel: why is an investment tracker more convenient?
Spreadsheets can suit a small portfolio, but manual formulas, multiple currencies, missed fees, and duplicate data become harder to manage as activity grows.
| Criterion | Excel / Google Sheets | Strum |
|---|---|---|
| Data updates | Mostly manual | Manual entry, import, or synchronization |
| Trades and fees | Formulas and separate rows | Structured transaction journal |
| P&L | Manual calculation | Portfolio analytics in the interface |
| Allocation | Separate tables and charts | Ready-made structure visualization |
| Rebalancing | Manual calculations | Templates and guidance |
| Goals | Separate file or tab | Goals connected with capital |