Asset analytics
Data for stock research
No more switching between different financial websites — every key valuation multiple, profitability metric and chart is one click away for any publicly traded company or ETF.
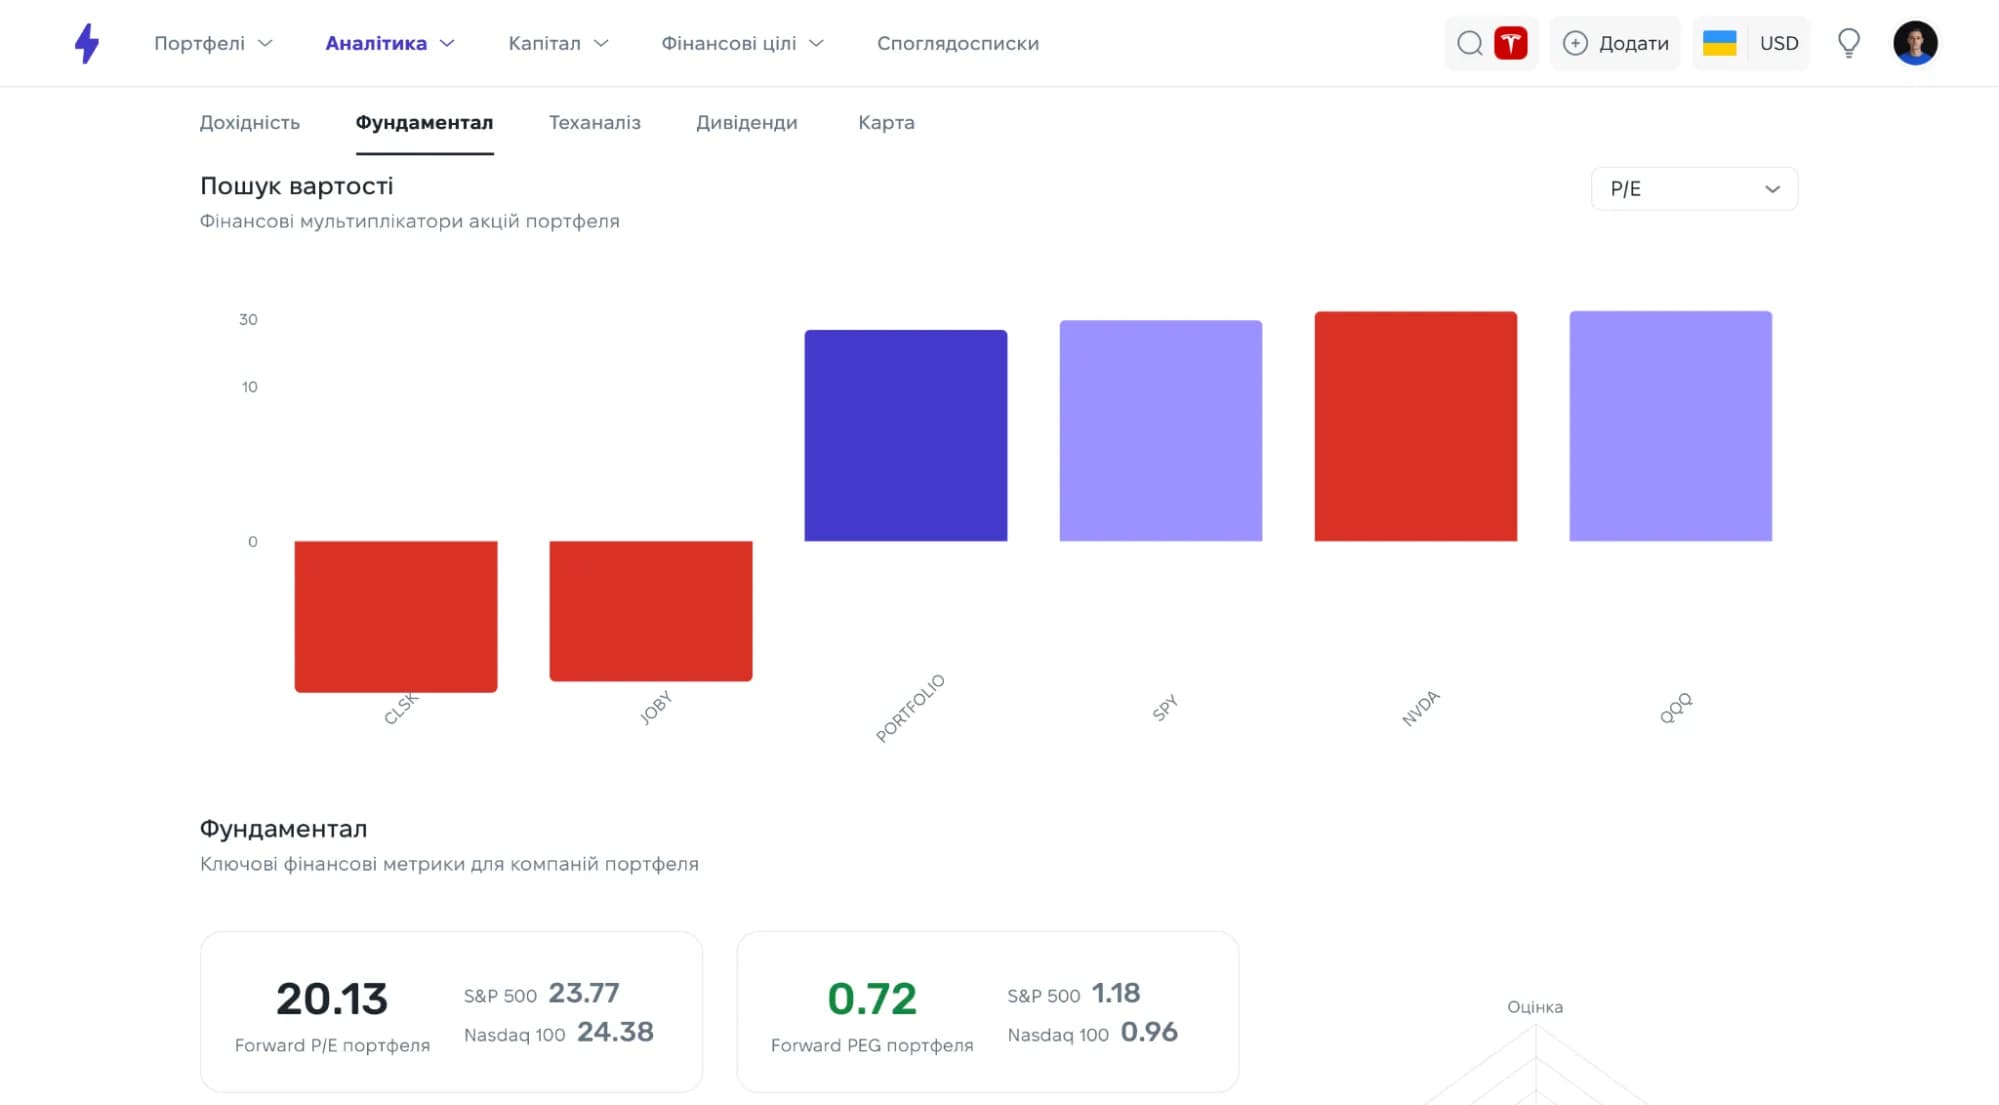
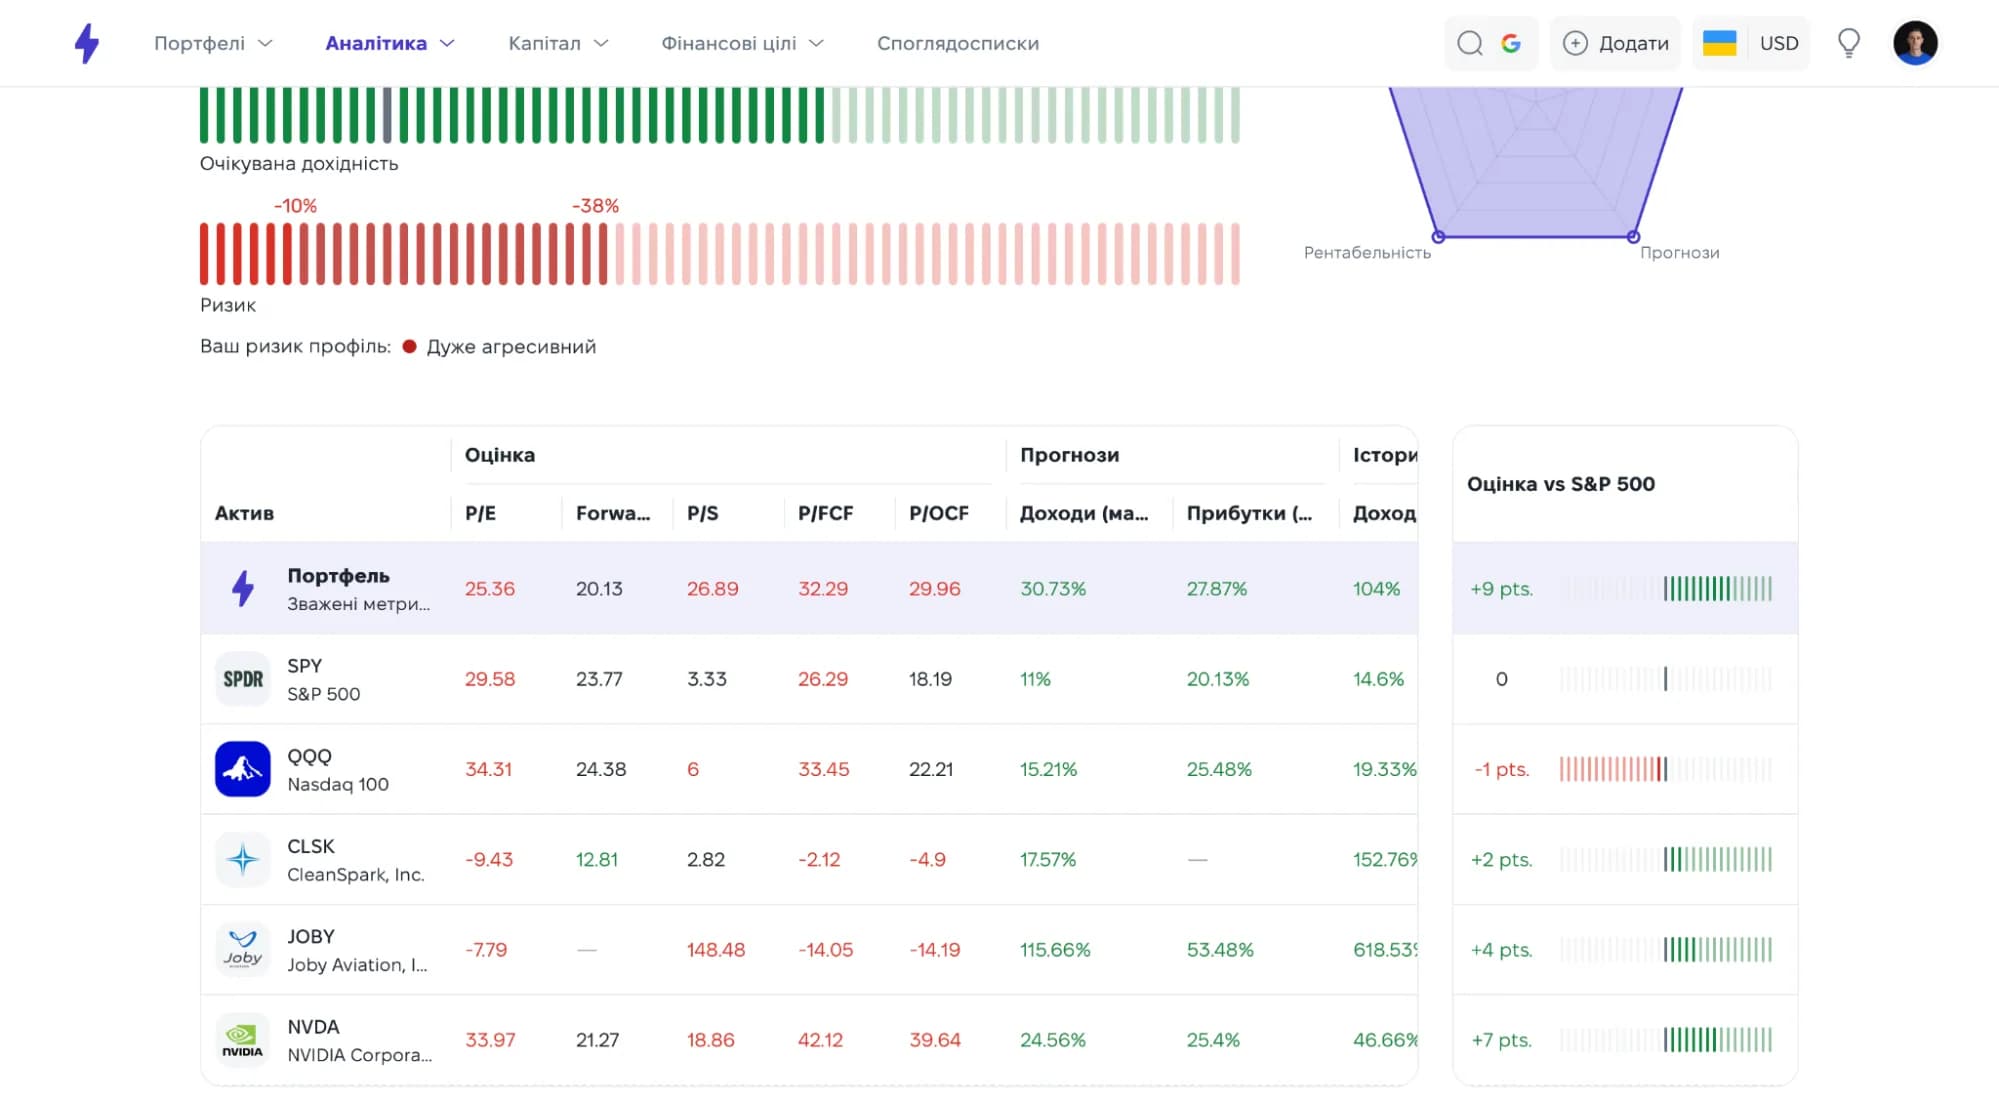
Fundamental valuation multiples
P/E, Forward P/E, P/S, P/B — instantly gauge what a company is worth using the key financial ratios.
Profitability and margins
ROE, ROA, gross and operating margin — see how efficient the business is.
Performance trends
Growth rates for revenue and net income over the past several years.
Dividend policy
Yield, dividend per share and payout ratio, so you can judge how sustainable the payouts are.
Financial strength
Debt/Equity and Current Ratio — judge the safety of your investment by its debt load.
Interactive charts
Prices delayed by 5 minutes, trading volume, and comparison against 52-week highs.
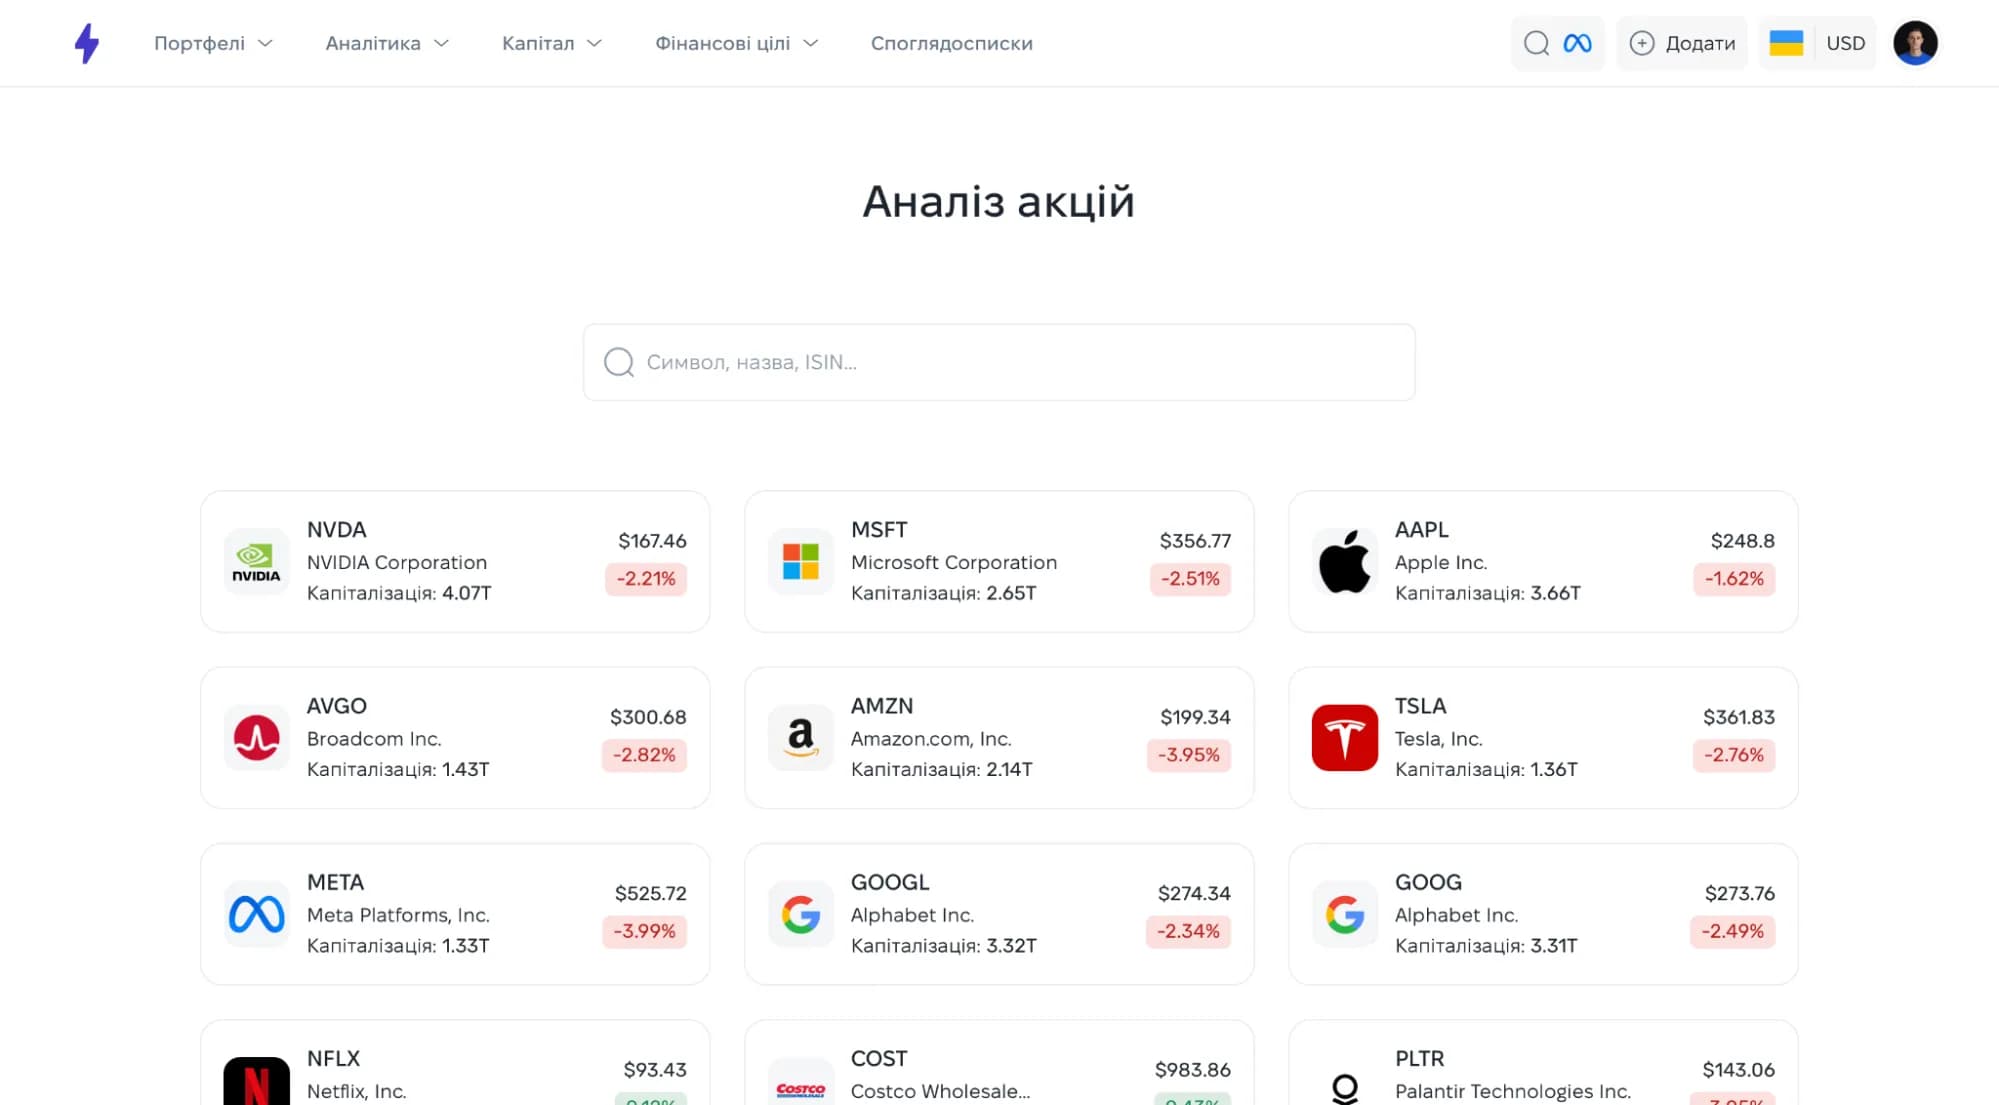
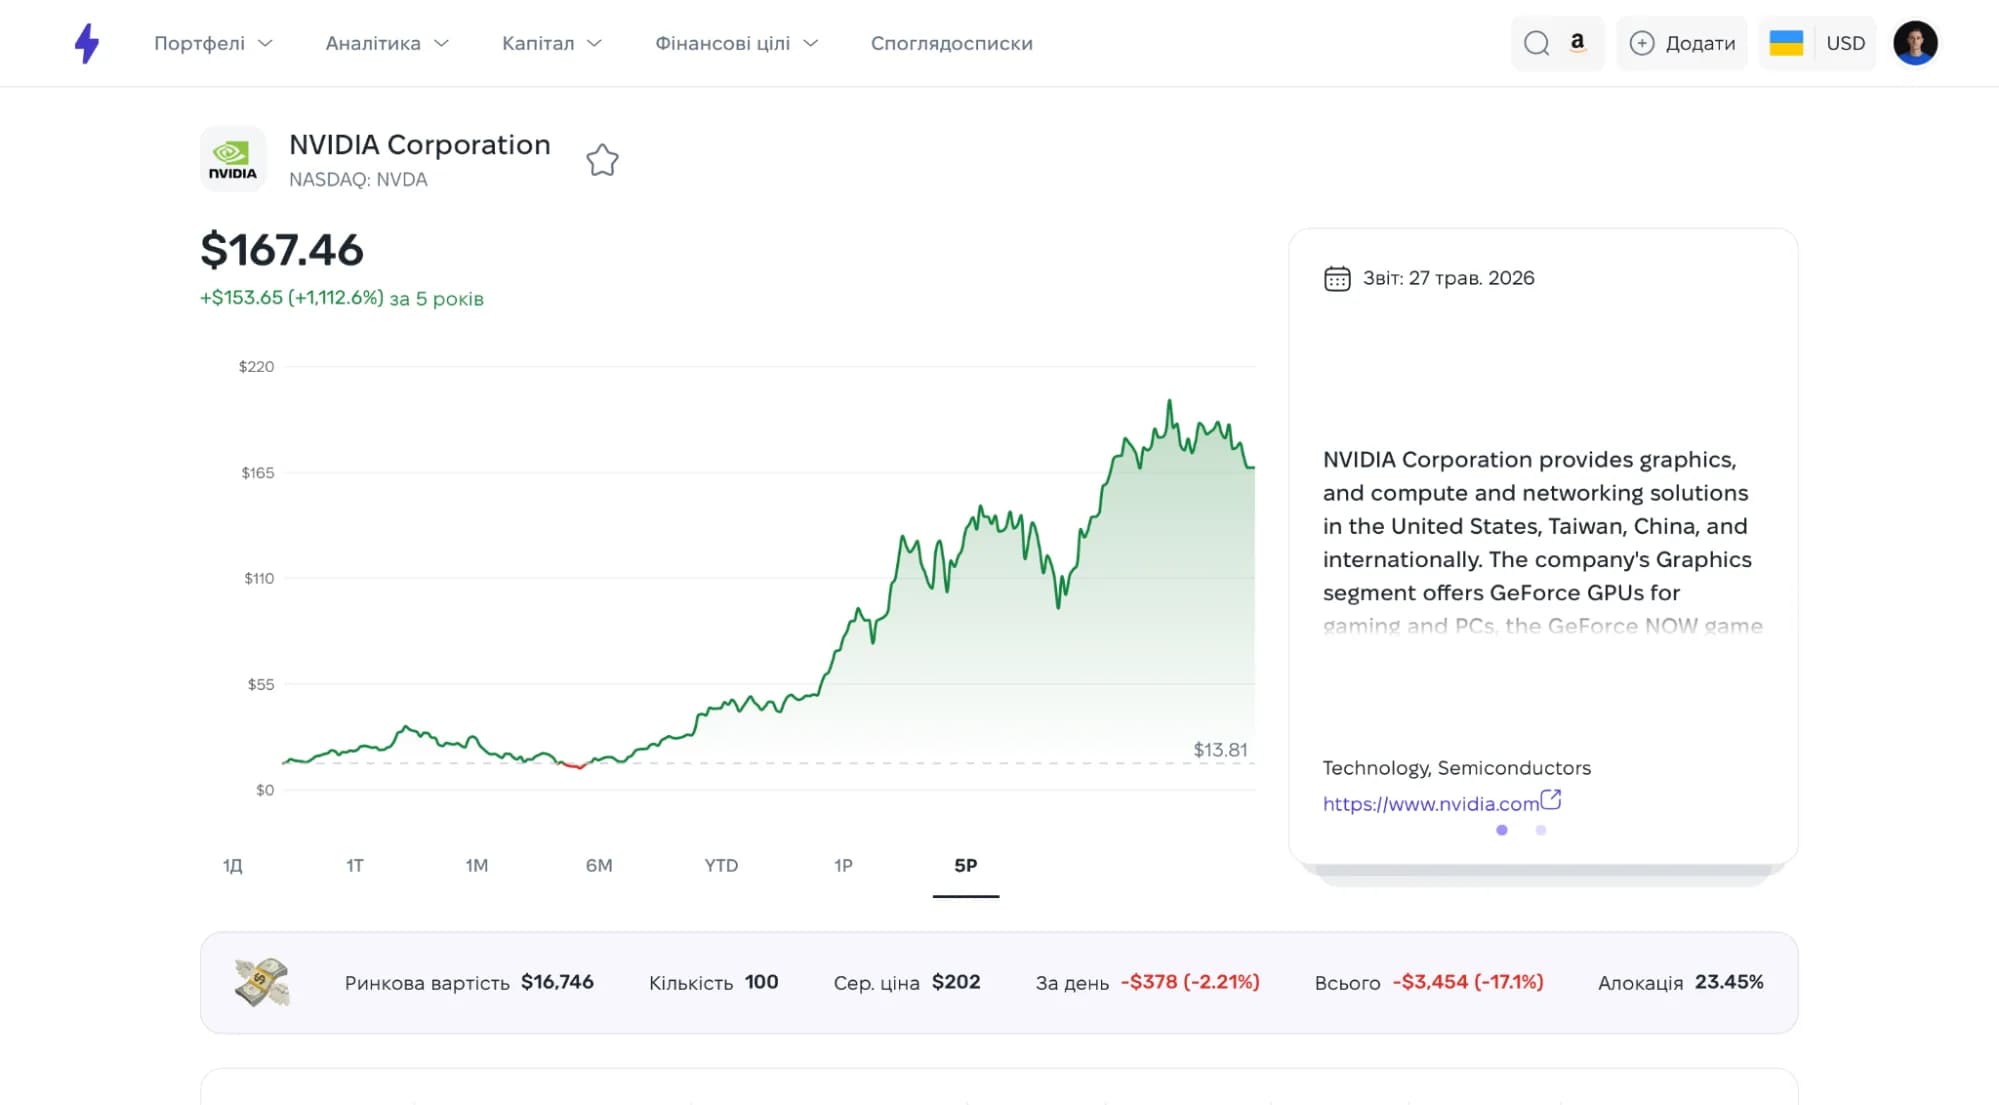
Strum brings key metrics into one interface and presents them with source limitations and update frequency.
Portfolio analytics
A deep look at how your investments perform
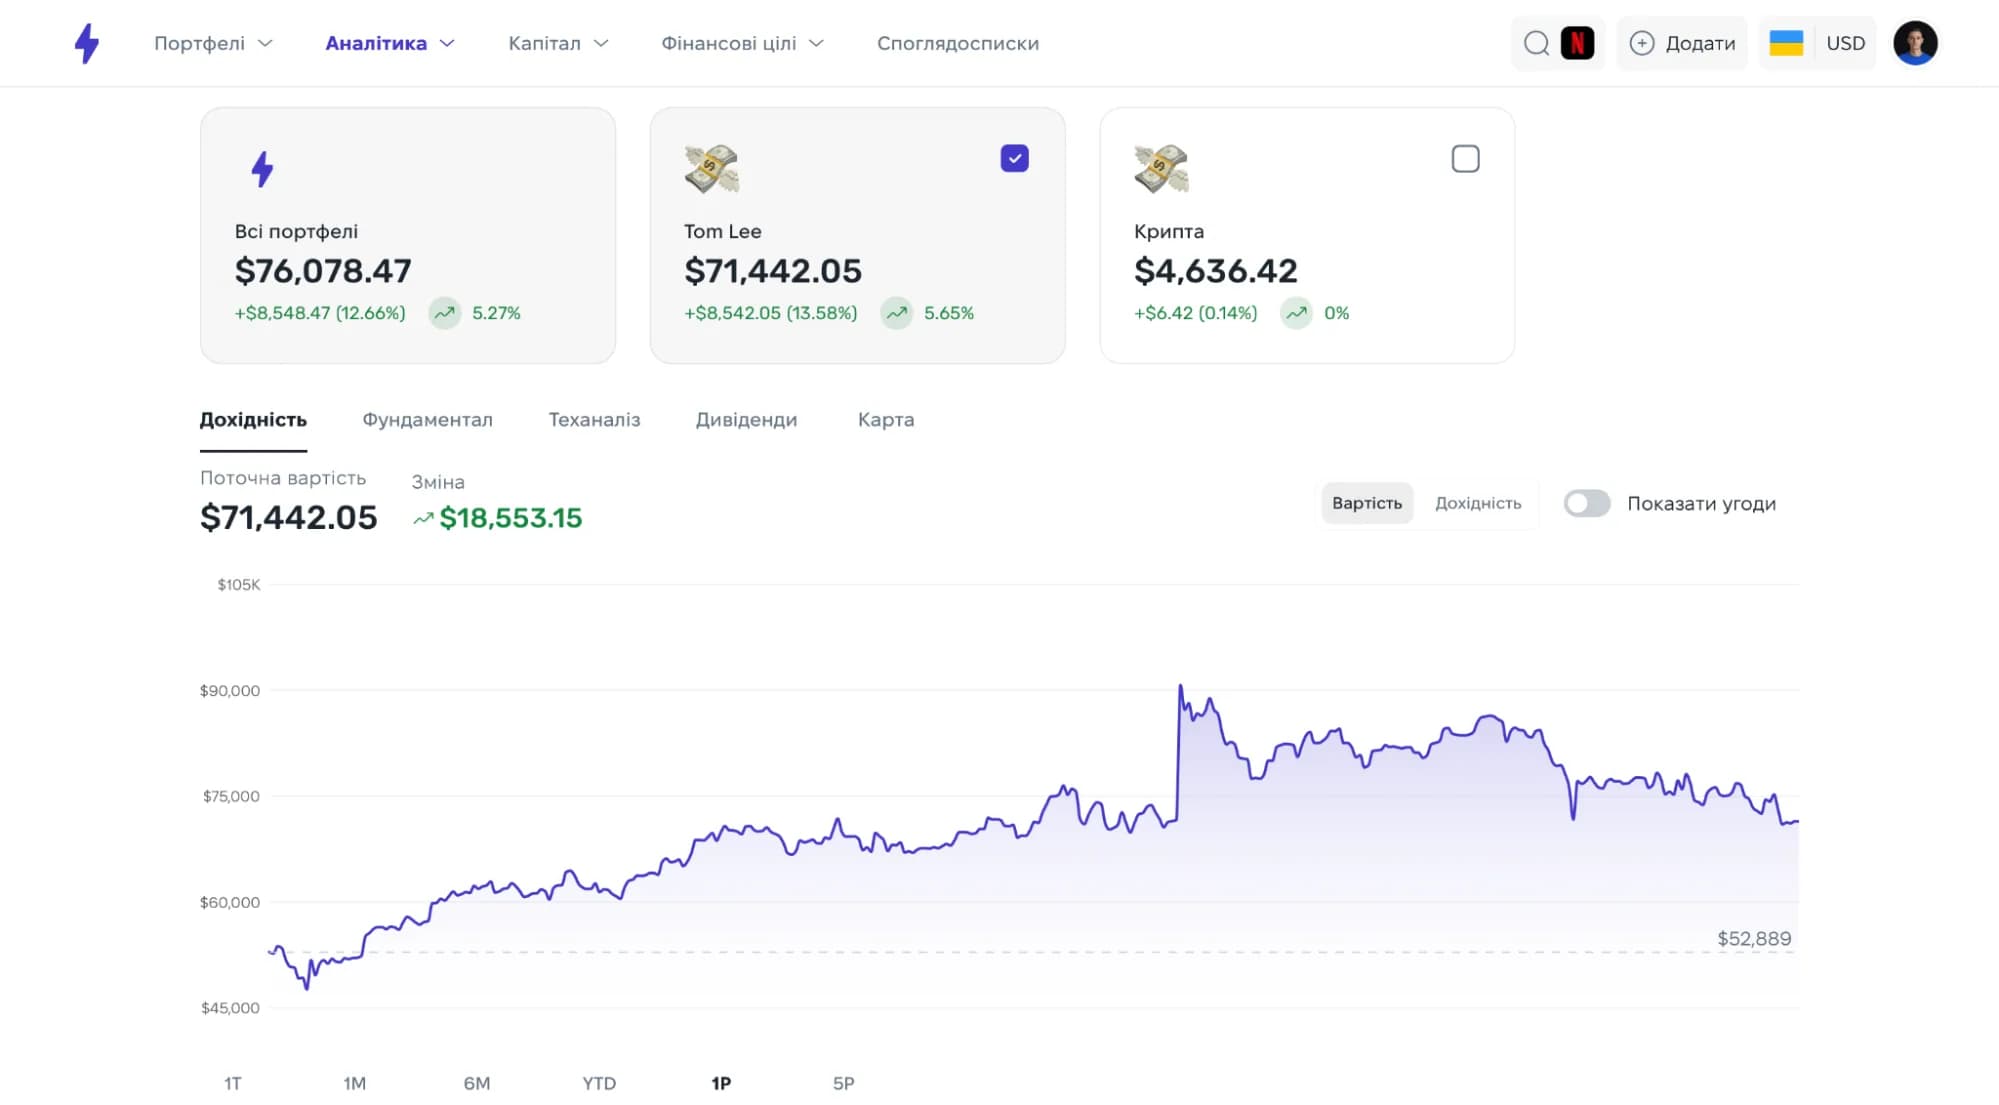
Your own financial report: raw transaction numbers turn into meaningful insight automatically. A complete performance breakdown of your portfolios over any period, so your decisions rest on facts rather than intuition.
Net profit (P&L) monitoring.realized and unrealized gains charted over time.
Net worth structure by asset class.clear charts of how your money is split across stocks, crypto and cash.
Dividend income analysis.payout history and a forecast of future dividend income.
Per-ticker performance.the weight of each holding, its average purchase price and its contribution to the overall result.
Granular time filtering.from a single day to your entire investing history.
Deposits and withdrawals under control.cost basis against current market value for your true ROI.
Sector and geographic breakdown.understand which industries and regions your investments sit in.
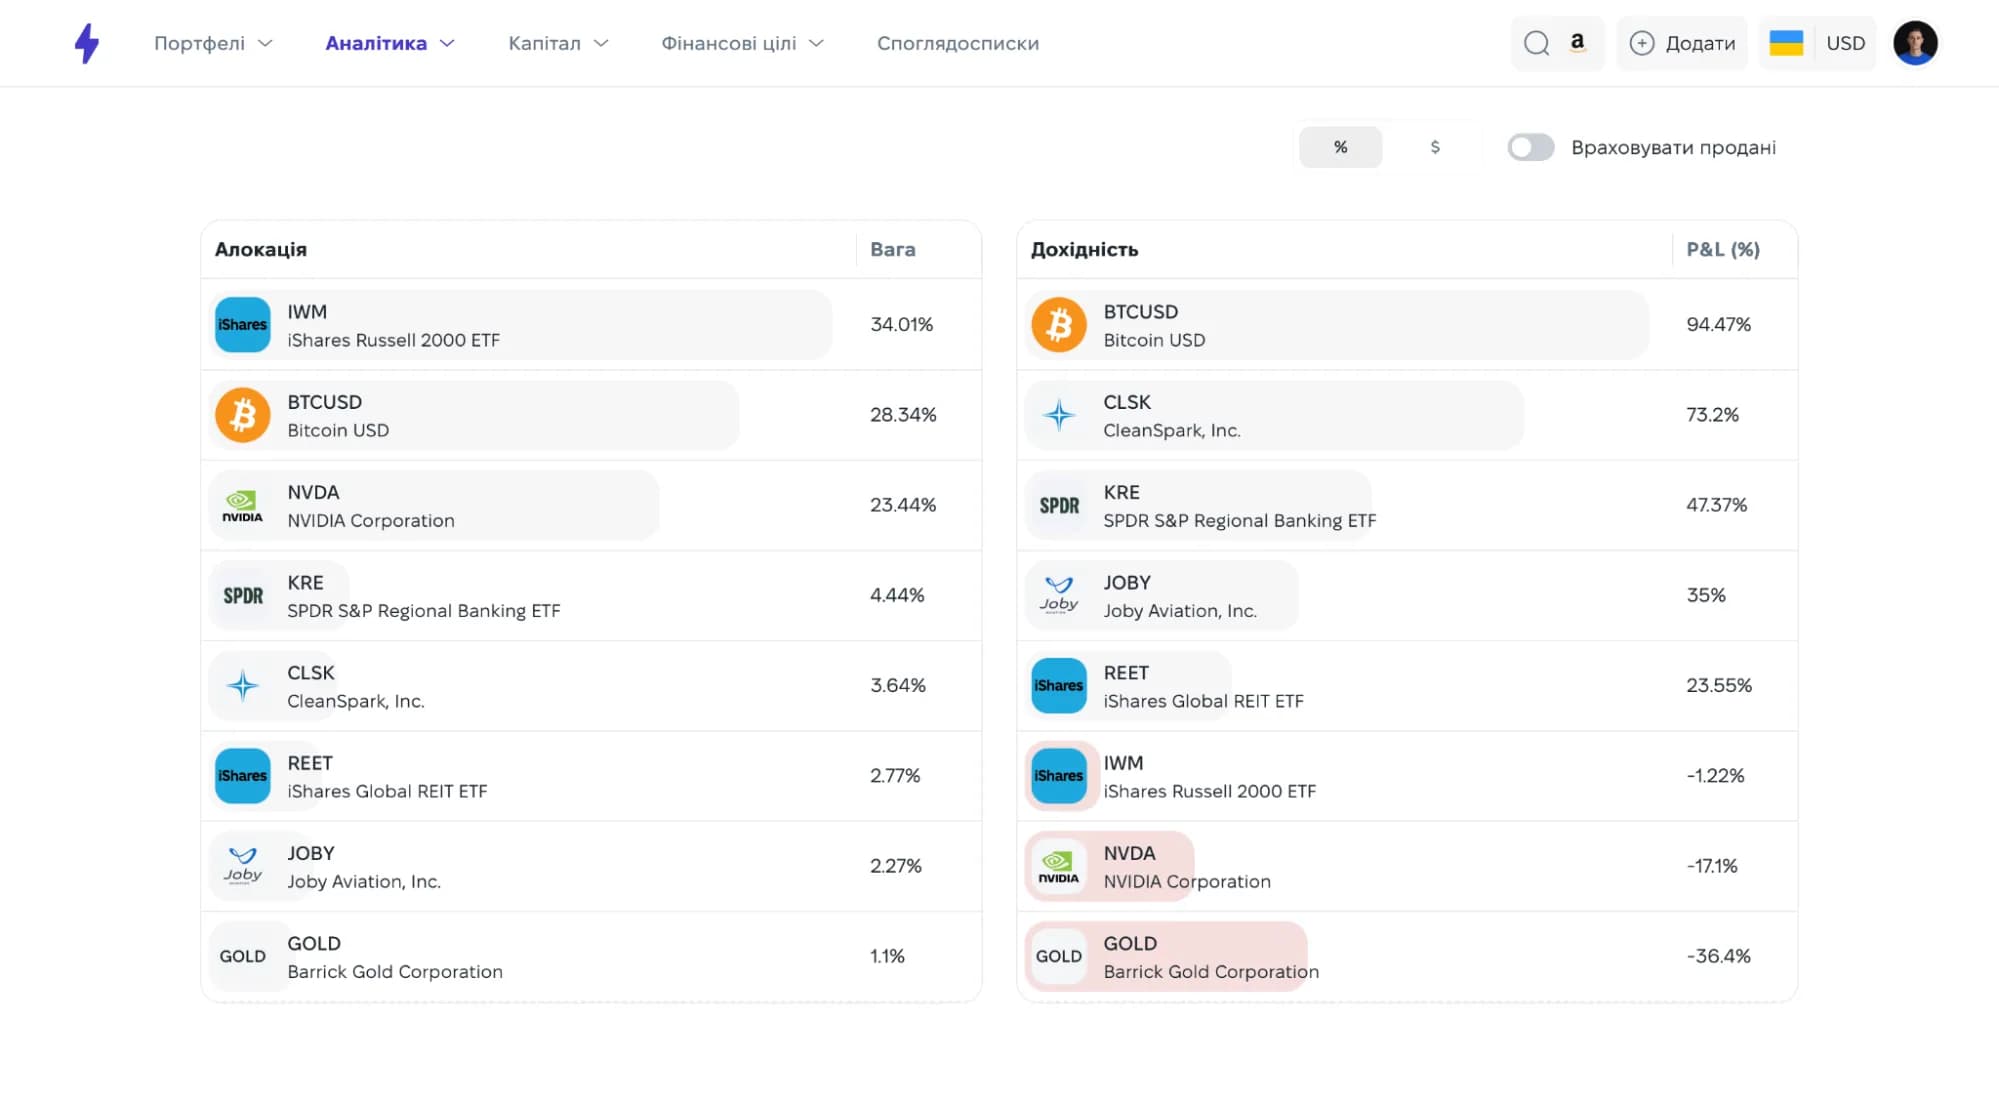
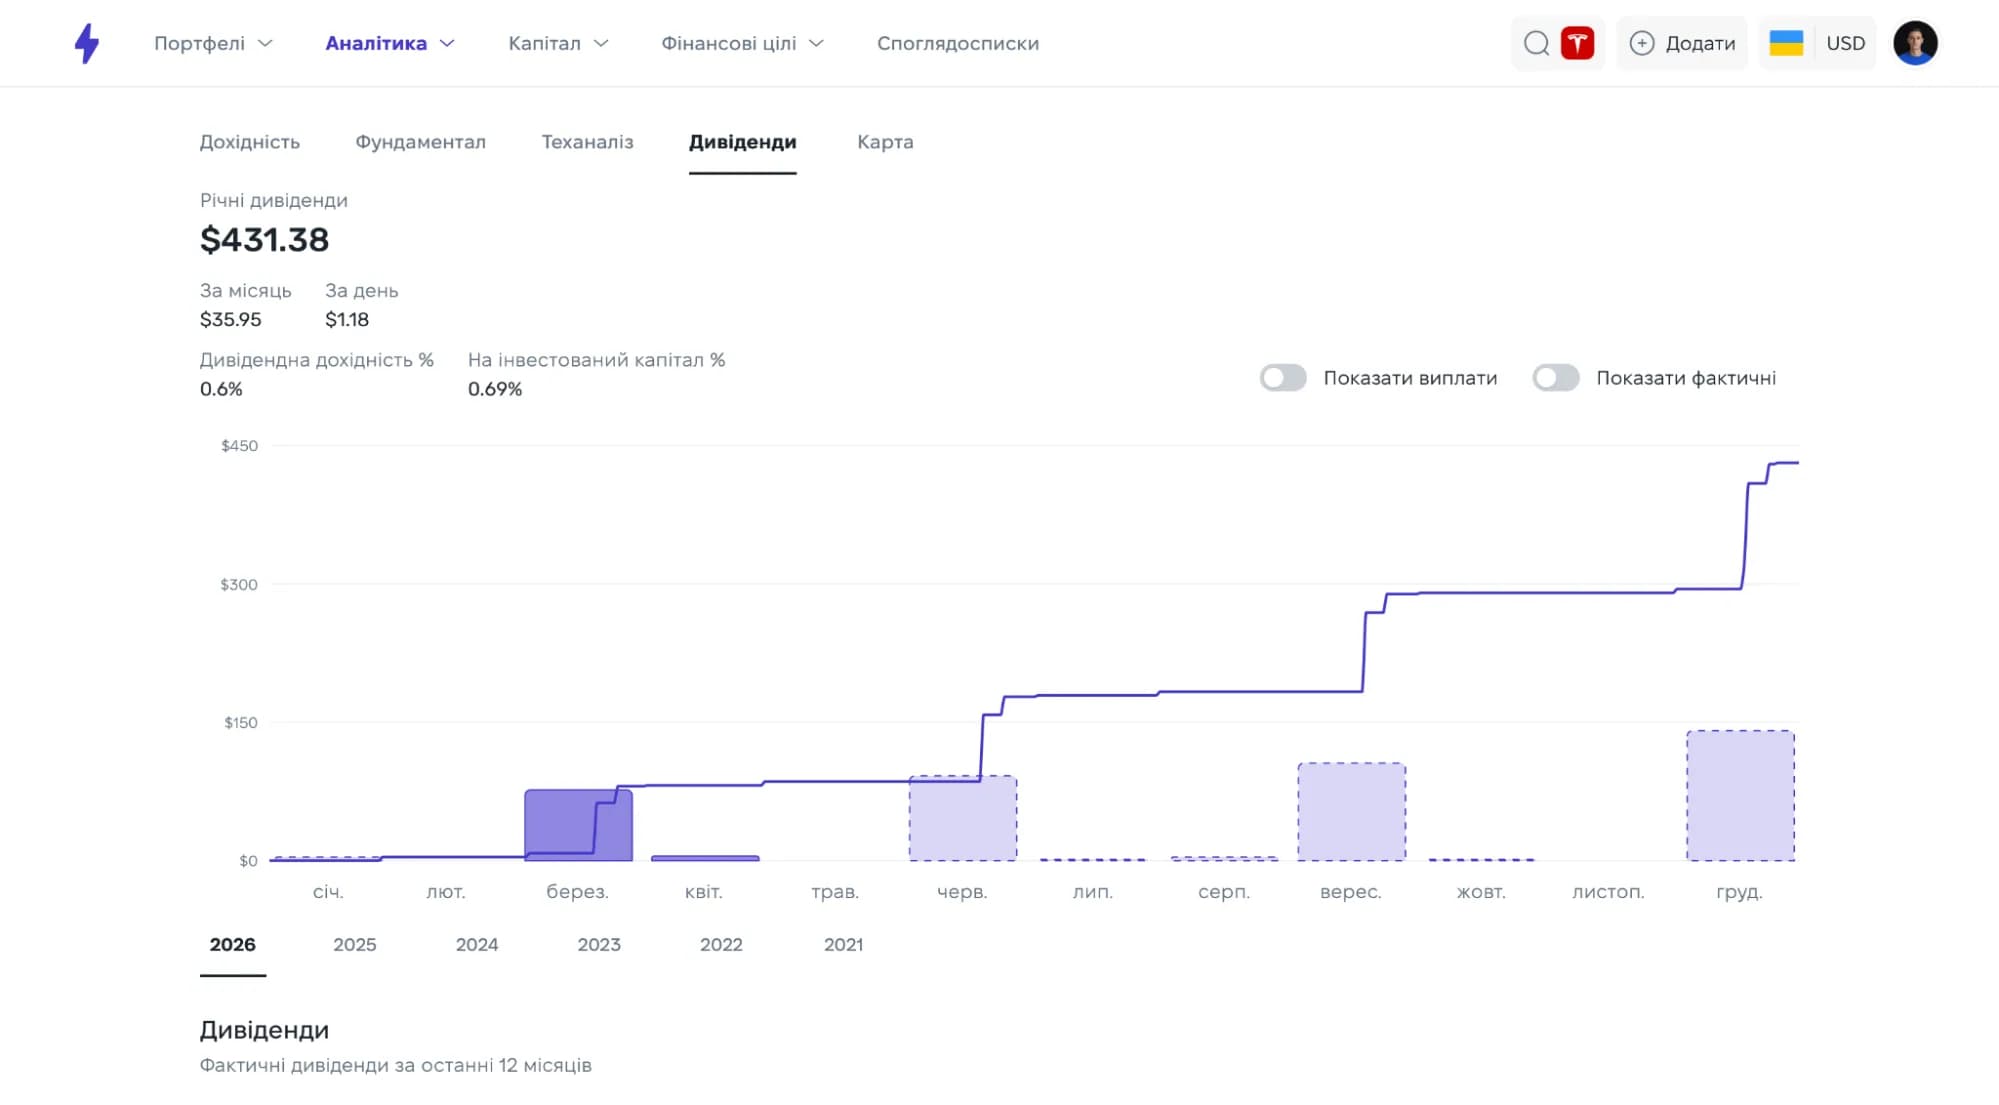
Strum makes portfolio analytics more accessible and transparent, but it does not replace source verification or an independent investment decision.
The details you used to work out by hand
Dividend income and payout forecasts in a clear calendar.
Analysis of how much each ticker contributes to your overall P&L.
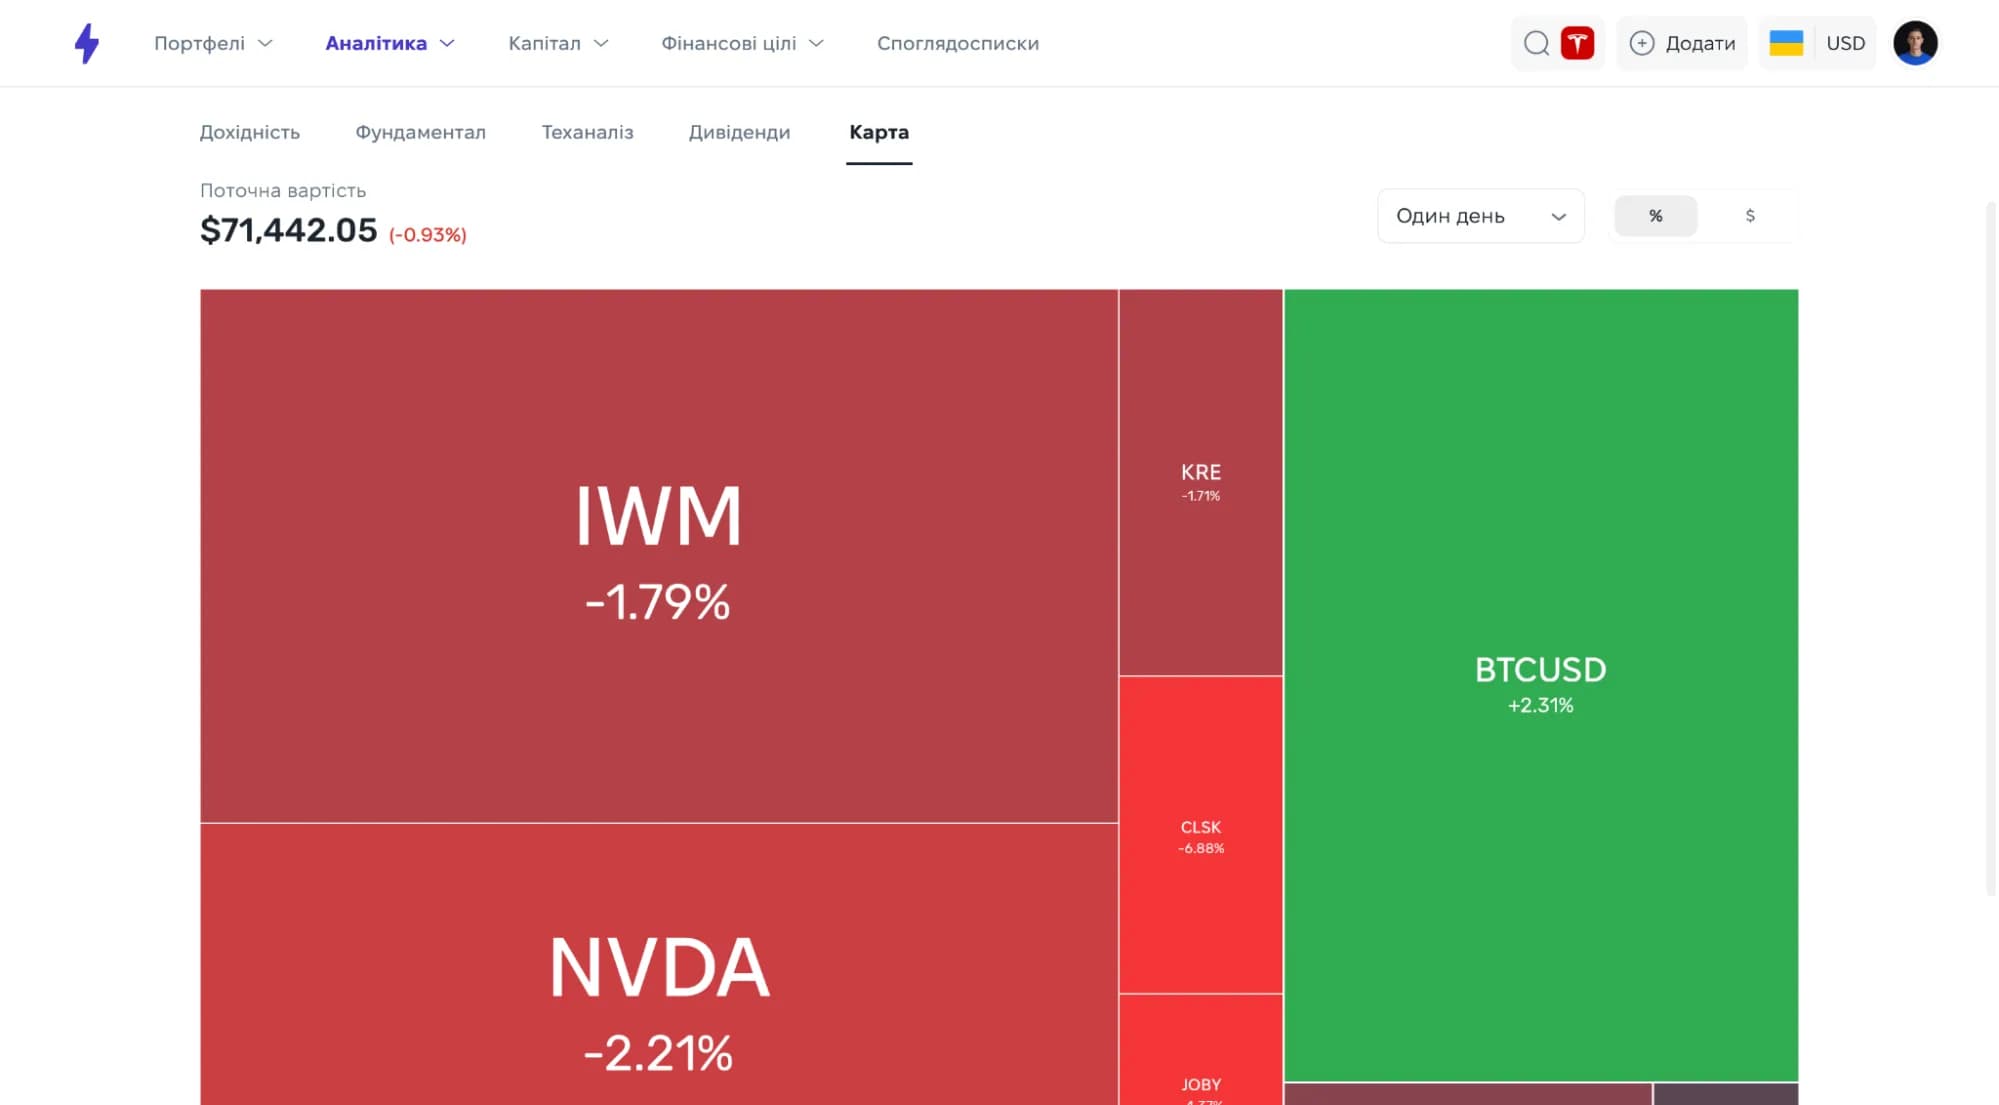
Sector map.spot an overweight in technology or any other industry.
Geographic diversification of your holdings — see the real split across regions.