Capabilities
Dividend tracker features
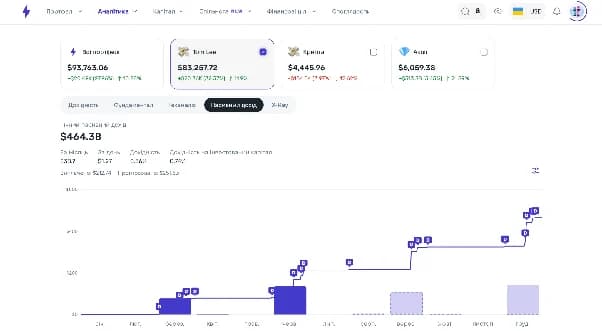
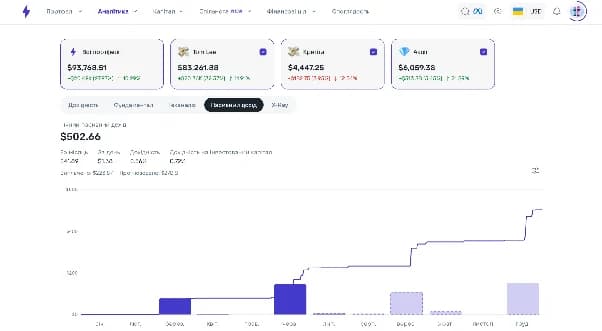
Payment history
Review received dividends and how they change over time.
Projected income
Estimate expected income and future payments.
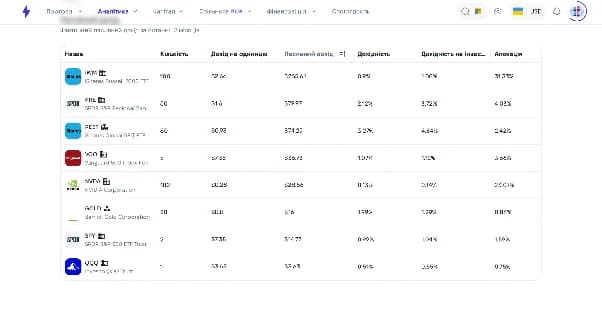
Asset analytics
See how individual stocks and ETFs contribute to total income.
One portfolio
Connect dividends, P&L, assets, and capital in one interface.
Simpler records
Replace manual formulas and disconnected financial spreadsheets.
Income organizer
How a dividend tracker simplifies income management
A dividend tracker acts as an organizer for regular portfolio reviews, so you do not have to reconcile payments, cash movements, and metrics manually.
See every dividend payment in one place.
Review payment frequency by month, quarter, or another period.
Estimate future distributions and approximate income.
Identify the assets that generate most dividend cash flow.
Analyze dividends alongside P&L, portfolio structure, and goals.
Strum does not replace a broker, execute trades, or distribute dividends. It helps users analyze data while investment decisions remain their responsibility.
Benefits
What does the Strum dividend tracker give you?
| Capability | What it gives an investor |
|---|---|
| Payment history | See what the portfolio has earned and how income changed |
| Income projection | Plan potential payments without a payment guarantee |
| Asset analytics | Find the stocks or ETFs driving the income stream |
| Portfolio context | Analyze dividends together with P&L and allocation |
| Assets and currencies | Manage a more complex dividend portfolio |
| Fewer spreadsheets | Reduce formula errors and save time |
Actual amounts and payment dates are determined by the issuer and broker. Strum does not replace tax documents, tax returns, or professional advice.
Who it is for
Who is the Strum dividend tracker for?
Private investors with dividend stocks or ETFs.
Owners of assets in several currencies who need one capital picture.
Users who monitor the regularity of dividend income.
People spending time on manual spreadsheet calculations.
Investors with several portfolios who want dividends beside all other assets.
Comparison
Why use Strum instead of a dividend spreadsheet?
A spreadsheet can be enough for the first few assets. As positions, currencies, and payments grow, a tracker reveals the connection between dividends, portfolio structure, capital, and goals.
| Criterion | Spreadsheet | Strum |
|---|---|---|
| Data updates | Mostly manual | Automated or semi-automated records |
| Errors | Formula errors are possible | Less repeated data entry |
| Portfolio analysis | Must be built manually | Analytics in the interface |
| Dividends + P&L | Combined manually | Analyzed together |
| Scaling | Harder with many assets | Designed for many positions |
| Financial goals | Separate sheets | Goals connect with the portfolio |
Getting started
How do you start using the Strum dividend tracker?
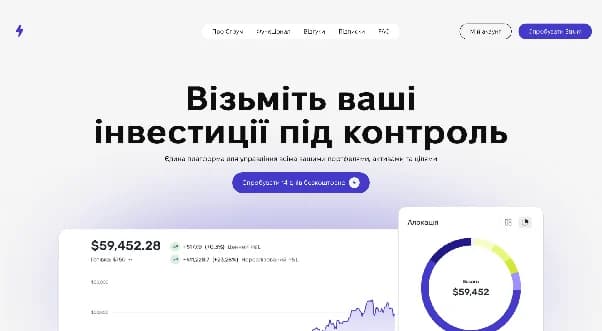
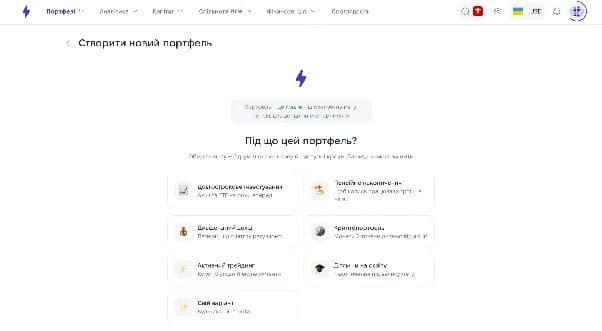
1. Create a Strum account
Create an account and try the service with your own data free for 14 days.
2. Add your portfolio
Enter assets manually, import a CSV or brokerage statement, or use an available synchronization.
3. Review payments and analytics
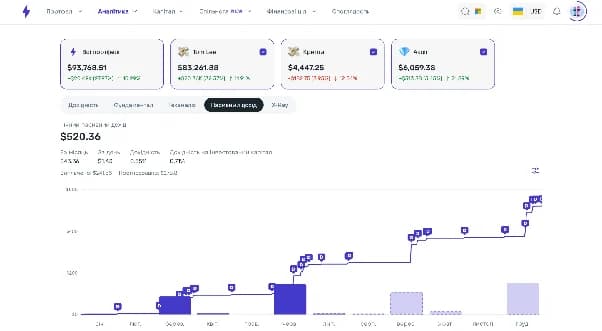
Compare dividend income with P&L, portfolio structure, and capital dynamics.
4. Use the data for planning
Compare actual distributions with expectations and assess each asset’s contribution to future passive income.